
Press Releases
Corruption Situation in Singapore Under Control
6 April 2015
Read CPIB's inaugural detailed corruption statistics report, covering trends from 2010 to 2014, showing Singapore's corruption levels are at a three-decade low.
This article has been migrated from an earlier version of the site and may display formatting inconsistencies.
Key Highlights
As part of its continuing efforts to provide greater transparency and promote a culture of zero tolerance against corruption, CPIB is releasing more detailed corruption statistics showing trends spanning 2010 to 2014. Key highlights from this inaugural report are as follows:
1. Corruption situation in Singapore remains stable
Number of complaints received reaches the lowest in the past 3 decades.
Number of cases registered for investigation reaches the lowest in the past 3 decades.
2. Corruption cases in Singapore remain low with private sector cases forming the majority
Private sector cases made up 85% of all registered cases for investigation in 2014.
Public sector cases made up 15% of all registered cases for investigation in 2014.
3. CPIB continues to stay vigilant and is exploring new ways to fight corruption with the community
As figures show that complaints lodged in person was the most effective mode to result in investigations, CPIB will set up a one-stop corruption reporting centre where members of the public can walk-in and lodge complaints conveniently and discreetly.
CPIB also regularly gives corruption prevention talks to both public and private sector organisations as well as organises exhibitions/ roadshows to spread the anti-corruption message to the wider community.
Corruption Situation in Singapore Under Control
Singapore is in a good state. Corruption is under control and the international measures such as Transparency International (TI) and Political and Economic Risk Consultancy (PERC) attest to Singapore remaining as one of the world’s least corrupt countries. “These achievements would not be possible without the formidable political will of our founding father, the late Mr Lee Kuan Yew,” said Director CPIB Mr Wong Hong Kuan. “Mr Lee was a tireless champion against corruption. His personal tenacity and deep sense of mission to rid corruption allowed the CPIB to discharge its duties fearlessly, and transformed a corruption-ridden society into a citizenry which now abhors corruption.”
2. However, a clean system is not a natural state of affairs. Corruption ultimately comes from weaknesses of human nature – greed, temptation, the desire to amass wealth or to obtain business through unfair means. Even with harsh penalties, there will still be some who will try to break the laws. Although Singapore is one of the least corrupt countries in the world, it is important that laws must be rigorously enforced and corrupt behaviour continues to be socially unacceptable.
Corruption Situation in Singapore Remains Stable
Lowest Number of Complaints Received By CPIB in Past 3 Decades
3. The number of complaints received by the CPIB decreased by 7% from 792 in 2013 to 736 in 2014 (Figure 1). This is the lowest number in the past 3 decades.
4. Besides corruption related complaints, the CPIB receives many other complaints which may pertain to other offences, such as cheating, misappropriating of public or company funds, etc. CPIB will refer all non-corruption related complaints received to the relevant authorities for their necessary action.
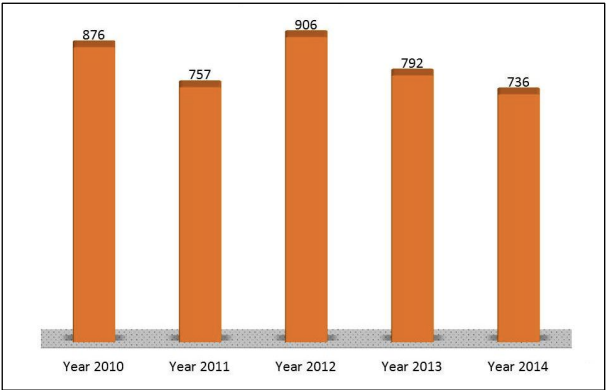
Figure 1: Number of Complaints Received By CPIB
5. The predominant mode through which the complaints were received by CPIB was through mail or fax, which made up 38% of all the complaints received by CPIB. Figure 2 shows the other modes through which the complaints were received for the year 2014.
6. The CPIB takes a serious view of all complaints with an undertone of corruption. All corruption complaints received by the CPIB will be channelled to the Complaints Evaluation Committee (CEC) for evaluation. The CEC, comprising members of the CPIB Directorate, will deliberate on each complaint and determine whether the complaints contain sufficient information for investigation or other follow- up actions. All complaints will be deliberated upon in the same manner regardless of the nature or amount of the gratification or whether the complainant has identified himself or choose to remain anonymous.
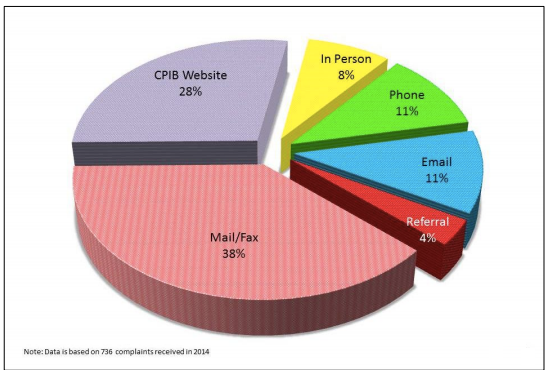
Figure 2: Modes of Complaints Received by CPIB in 2014
Lowest Number of Cases Registered for Investigation in Past 3 Decades
7. In 2014, 136 cases out of the 736 complaints received were registered for investigation. This was an 11% decrease from the 152 cases registered for investigation in 2013 (Figure 3). This was also the lowest number of cases registered in the past 3 decades.
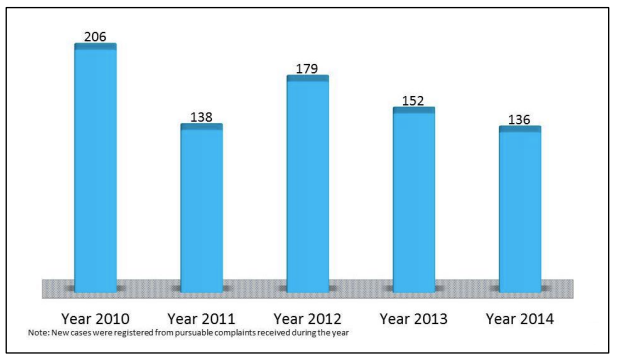
Figure 3: Total Number of Cases Registered for Investigation
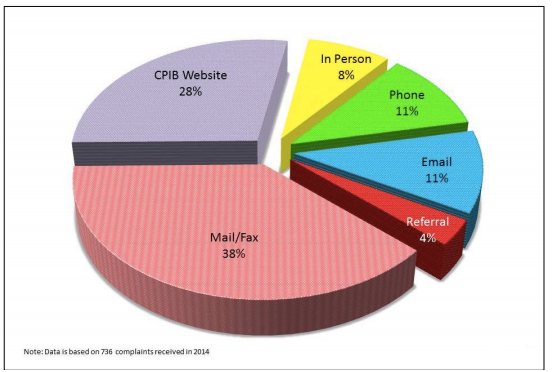
Figure 4: Modes of Complaints which Resulted in Investigations in 2014
8. Figure 4 shows the different modes of the complaints that resulted in investigation for the year 2014. The figures showed that complaints lodged in person as the most effective mode as it was 3 times more likely to result in investigation compared with the most popular mode of email/fax.
Corruption cases in Singapore remain low with private sector cases forming the majority
Majority of Cases Registered for Investigation Involved Private Sector
9. Corruption cases in Singapore remain low with private sector cases forming the majority. In 2014, 85% of the 136 cases registered for investigation involved private individuals giving, offering or receiving bribes. Only 15% of the cases registered for investigation in 2014 involved public officers. It is worth mentioning that of 85% of these private sector cases, 13% involved public officers rejecting bribes offered by private individuals (Figure 5).
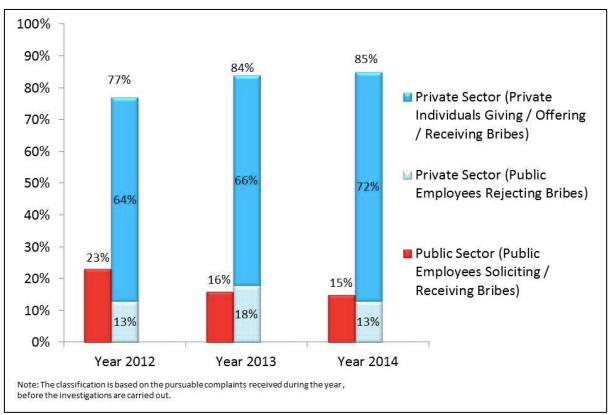
Figure 5: Breakdown of the Cases Registered by Public vs Private Sector
Effectiveness of the Singapore Corruption Control Framework
Consistent Yearly Clearance Rate
10. In 2014, the CPIB handled a total of 541 cases, of which 136 cases were new cases registered for the year and 217 were added new cases registered in the course of investigation while 188 were existing cases brought forward from the previous year. The total number of cases handled by the CPIB each year did not deviate much over the last 3 years (Figure 6).
11. This consistent trend also translated into a stable yearly clearance rate for the CPIB in the last 3 years. In 2014, 77% of the cases investigated by the CPIB were completed (Figure 7).
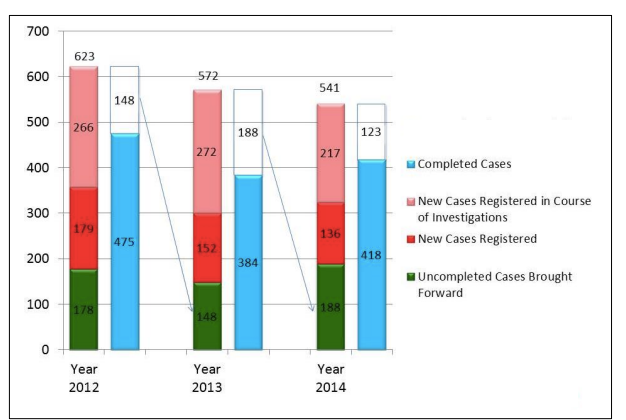
Figure 6: Total Number of Cases Handled in a Year
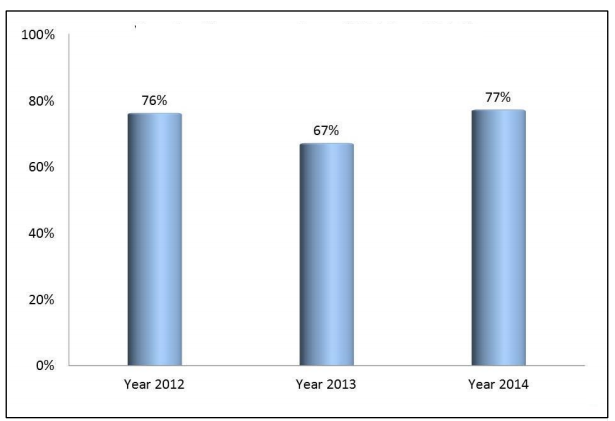
Figure 7: Yearly Clearance Rate
Private Individuals Formed Majority of Persons Prosecuted in Court
12. Over the last 3 years, the average number of persons prosecuted, as a result of CPIB investigation, was 170. Besides corruption related offences, the CPIB can also investigate and charge offenders for non-corruption offences uncovered in the course of corruption investigations, which include Penal Code and immigration offences etc.
13. In 2014, the number of private individuals prosecuted in Court by the CPIB accounted for 88% (Figure 8). Despite the high profile cases involving public servants in recent years, these are the minority. Public officers prosecuted in Court remained small at an average of 9% in the last 3 years.
14. In 2014, from the number of private individuals prosecuted in Court for corruption related offences, 3 main areas of concern were noted:
i.Construction (eg. showing leniency in the inspection of work, bidding for contracts to supply electrical and engineering equipment);
ii.Sales of household goods in departmental stores (eg. bribing offront-line employees to perform corrupt transactions); and
iii.Warehouse and logistic services (eg. giving bribes corruptly to obtain contracts)
Cases in brief are appended (Annex A).
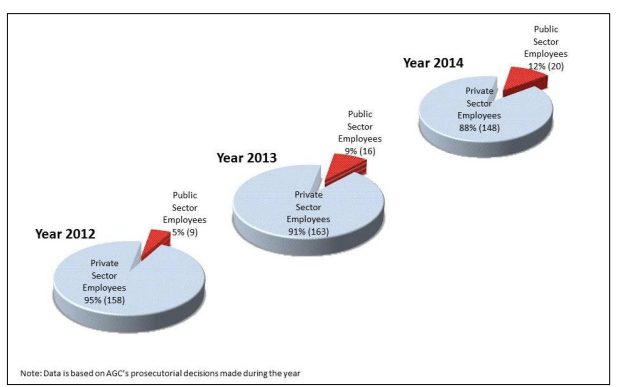
Figure 8: Public and Private Sector Employees Prosecuted in Court
High Conviction Rate for CPIB Cases
15. Under the Prevention of Corruption Act (PCA), any person convicted of an offence is liable to a fine of up to $100,000, imprisonment for up to five years, or both. Where the offence involves a government contract or bribery of a Member of Parliament, imprisonment may be extended to seven years.
16. The conviction rates (excluding withdrawal) for cases charged by the CPIB for corruption offences and other related offences remained high for the past 3 years, well above 95% mark. The CPIB has played an important part in keeping the system clean. The high conviction rate is testament to Singapore’s zero tolerance approach towards corruption and the robust anti-corruption system, which is constantly being reviewed to ensure Singapore remains at the cutting edge of fighting corruption.
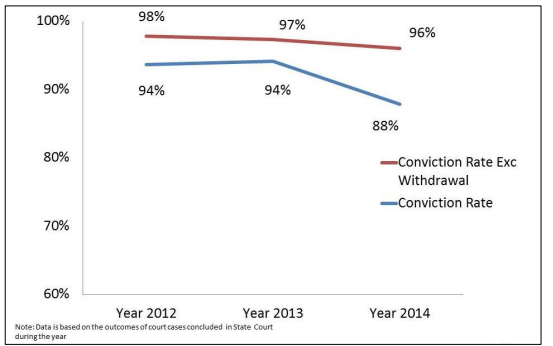
Figure 9: Conviction Rate
The CPIB - Swift and Sure, Firm but Fair Action
17. The CPIB takes a serious view of any corrupt practices in Singapore and will not hesitate to take action against any parties involved in corrupt practices.
Case-in-point:
Sex-for-fixing: Corrupt Lebanese match officials and match-fixer Eric Ding Si Yang Two days before an Asian Football Confederation Cup match between Singapore-based club Tampines Rovers and India's East Bengal, the CPIB received information that a match-fixer was going to meet up with the match officials. Within hours, the CPIB had established the identities of the suspected match-fixer to be businessman Eric Ding Si Yang and the three match officials involved. The CPIB acted swiftly and surely in gathering the necessary incriminating evidence, leading to the match officials admitting to the scheme within 48-hours of their arrest. These confessions were then used as key evidence in Court to convict Ding. Ding was sentenced to three years’ jail in July 2014, after being found guilty of three charges of bribing Lebanese football officials with prostitutes, as an inducement to fix matches they would officiate in future. The prosecution had pressed for a stiff ‘exemplary’ penalty in view of public interest, and stated that although no match-fixing had taken place, Ding should not be given leniency just because the authorities were efficient in their arrests. On 16 January 2015, Ding had his jail term increased from three years to five years, after the High Court ruled that the earlier sentence was manifestly inadequate. |
CPIB continues to stay vigilant and is exploring new ways to fight corruption with the community
18. Besides vigorous enforcement, the CPIB continues to focus on public education and community outreach to spread the anti-corruption message. The CPIB regularly gives corruption prevention talks to ministries and statutory boards, and in certain circumstances, help some government agencies improve on their processes and procedures in areas where there are gaps.
19. The CPIB also implemented several key initiatives in 2014 to spread the anti- corruption message to the public and wider community. These included an exhibition cum roadshow that was organised at the Toa Payoh HDB Hub Mall in collaboration with the Football Association of Singapore. Entitled “Unite Against Corruption”, the objectives of the event were mainly to create awareness and educate the public on corruption issues. In the same year, the CPIB also ran a Unite Against CorruptionVideo Competition which garnered entries from members of the public (the videos can be viewed at www.youtube.com/CPIBsingapore). In addition, the CPIB launched its first social media platforms in the form of Facebook (www.facebook.com/cpibsg) and Twitter (@CPIBsg). These initiatives had drawn positive responses from the public.
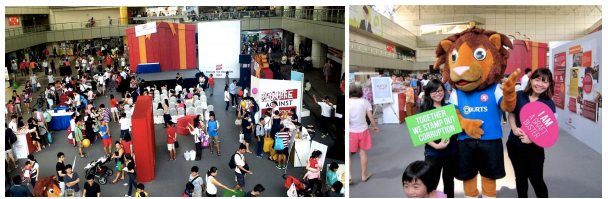
^Unite Against Corruption exhibition cum roadshow held at Toa Payoh HDB Hub
20. The CPIB is constantly exploring new ways to fight corruption with the community. In the Public Service Values Conference in January 2015, Prime Minister Lee Hsien Loong announced some key initiatives of CPIB. These include building up CPIB’s capabilities, reviewing the Prevention of Corruption Act (PCA) and setting up a one-stop corruption reporting centre in the city. Members of the public can expect to lodge complaints more conveniently and discreetly in a friendlier and more comfortable environment. One of the primary aims of this new facility is to encourage more walk-in complaints.
Private Sector Engagement
21. To spread the anti-corruption message to the private sector, the CPIB provides talks to private companies whose employees may be susceptible to corruption. Upcoming initiatives by the CPIB include the development of an anti- bribery package.
Zero tolerance to Corruption
22. With a strong mandate from the Government, the CPIB fights corruption holistically with the Attorney-General’s Chambers resulting in efficient investigations and a high conviction rate. Along with active public education and community outreach efforts, the CPIB also constantly explores new and effective ways to fight corruption together with the community.
23. In spite of these good results, the CPIB continues to stay vigilant and work with the public to safeguard Singapore’s integrity and national interests. The CPIB upholds the highest level of incorruptibility and remains relentless in combating corruption through swift and sure, firm but fair action. We strongly encourage those with information about corruption to use the following channels to reach us:
i.Walk-in to the CPIB at 2 Lengkok Bahru, Singapore 159047;
ii.Call us on our 24-hour hotline at 1800-376-0000; or
iii.Lodge an online complaint at www.cpib.gov.sg.
Corrupt Practices Investigation Bureau
Annex A
Cases in Brief
Construction
Bribes for construction of terrace house
In January 2014, Lee Kian Hwa, a Project Manager of Integrated Building Construction Pte Ltd, was fined $10,000 after being found guilty of three charges of corruptly obtaining bribes totalling $10,000 from Chong Tet Foh, a Director of De Fong Builder Pte Ltd, in return for awarding a contract for the construction of a terrace house. Lee received the bribes between the period January and March 2011. Chong was also fined $10,000 after being found guilty of three charges of corruptly giving bribes to Lee.
Corrupt transactions for construction work
In January 2014, See Chye Soon Ronnie, a Project Manager of Asia Development Pte Ltd, obtained a bribe of $3,000 from Lee Ah Kow, a Director of Qi Yang Construction Pte Ltd in return for engaging Qi Yang Construction Pte Ltd for the supply of labour at two construction work sites. See had also obtained a bribe of $5,000 from Tan Meng Liang, a Director of Aqua Dolphin Maintenance & Engineering Services Pte Ltd, in the same period for recommending Aqua Dolphin Maintenance & Engineering Services Pte Ltd for the construction of swimming pools at three work sites. In September 2014, See was fined $15,000 after being found guilty of two charges of corruptly receiving bribes totalling $8,000.
In November 2014, Lee and Tan were each fined $8,000 and $11,000 respectively after being found guilty of one charge each of corruptly giving bribe to See.
Sales of household goods in departmental stores
Unfair promotion of electrical products
In January 2014, Chua Hock Chuan, a sales promoter of HC Shinco International Pte Ltd (“Shinco”), was fined $7,000 after being found guilty of conspiring with two Shinco staff to corruptly give bribes totalling $1829 to three sales personnel of Mohamed Mustafa & Samsuddin Co Pte Ltd (“Mustafa”) to promote and sell Shinco products over other competitors’ products at Mustafa Centre. The three sales promoters of Mustafa were subsequently found guilty of corruptly receiving bribes They were fined amounts varying from $2,000 to $11,000 and ordered to pay a penalty varying from $209 - $1510.
Warehouse and logistics services
Corrupt transport services for road show events
In December 2014, Lee Qing Rui, an Assistant Senior Executive of Sony Electronics (Singapore) Pte Ltd (“Sony”), was found guilty of corruptly obtaining bribes totalling $127,880 from Ling Charng Shing, a sole proprietor of LCS Transport and Services to engage LCS Transport and Services for Sony road show events. Lee was sentenced to five months’ imprisonment and a penalty of $127,880. Ling was sentenced to nine weeks’ imprisonment in the same month, after being found guilty of corruptly giving bribes to advance the business interest of LCS Transport and Services.